How to Use Google Analytics to Track Conversion Rates
How to Use Google Analytics to Track Conversion Rates
Ever wondered if your website is actuallyworkingfor you, or just hanging out there collecting virtual dust bunnies? Let's dive intohow to use Google Analytics to track conversion ratesand turn those digital cobwebs into cold, hard cash.
Step One:
How to Master Google Analytics: A Beginner’s Guide to Conversion Tracking
Step Two:
Alright, friends, let's talk about something that probably keeps you up at night: conversion rates. Yeah, that magical number that tells you if your website is actuallydoing its job—turning visitors into paying customers (or newsletter subscribers, or demo requestors, or whatever your heart desires!).
Think of it this way:you've poured your heart and soul (and probably a good chunk of your budget) into creating a beautiful, user-friendly website. You're driving traffic through SEO, social media, maybe even some paid ads. But if all those visitors are just showing up, poking around, and thenleaving without doing anything, it's like throwing a party where no one dances. What's the point?
That's where Google Analytics (GA) comes in. It's like your website's personal detective, silently gathering clues about visitor behavior and helping you understandwhypeople aren't converting. Are they getting lost in your navigation? Are they confused by your pricing? Is your call-to-action about as compelling as a wet noodle? GA can tell you!
Now, I know what you're thinking: "Google Analytics? That sounds complicated!" And yeah, it can be a bit intimidating at first glance. All those reports and metrics and segments... it's enough to make your head spin. But trust me, once you get the hang of it, it's an incredibly powerful tool. Think of it as learning to ride a bike – wobbly at first, but exhilarating once you get the balance.
Imagine this: you're selling handmade cat sweaters online. You've noticed a drop in sales lately, and you're pulling your hair out trying to figure out why. With GA, you can see if the problem is: Traffic: Are fewer people visiting your site overall? Bounce Rate: Are people leaving your homepage almost immediately? Cart Abandonment: Are people adding sweaters to their cart, but then disappearing before completing the purchase? Specific Page Issues: Is a certain product page performing particularly poorly?
By identifying the bottleneck in your sales funnel, you can focus your efforts on fixing theactualproblem, instead of just guessing and throwing money at random solutions.
And the best part? Google Analytics isfree! Seriously, there's no excuse not to be using it. It’s like having a free consultant available 24/7, whispering sweet nothings (or, you know, data-driven insights) into your ear.
So, you're ready to dive in, right? You're itching to uncover the secrets hidden within your website data and start optimizing for conversions.
But wait! Before you get lost in the sea of metrics, we need to lay the foundation. We need to understand the basics of setting up conversion tracking in Google Analytics. Don't worry, we'll walk through it step-by-step, holding your hand like a parent teaching their child to ride that aforementioned bicycle. Think of it as unlocking the secrets that will make your website work smarter, not harder, and turn those casual browsers into loyal customers.
Are you ready to transform your website from a digital brochure into a conversion-generating machine? Let’s get started!
Step Three:
Understanding Conversion Tracking with Google Analytics
Before we get our hands dirty, let's define what we're actually trying to achieve. In the context of Google Analytics, aconversionis simply a completed action that you deem valuable to your business. This could be anything from a purchase to a form submission to a video view. Tracking these conversions allows you to seehow wellyour website is achieving its goals. To understandhow to use Google Analytics to track conversion ratesyou need to first set up goals.
Defining Your Conversion Goals: This is the most important step. What do youwantvisitors to do on your website? Here are some common examples: E-commerce: Completing a purchase, adding an item to the cart, viewing a product page.
Lead Generation: Submitting a contact form, downloading a whitepaper, signing up for a newsletter.
Brand Awareness: Watching a video, visiting a specific page (e.g., your "About Us" page), spending a certain amount of time on your site.
Service-Based Businesses: Requesting a quote, scheduling a consultation, initiating a live chat.
Think carefully about your business objectives and identify the key actions that contribute to those objectives. You might have multiple conversion goals, and that's perfectly fine. Each goal represents an opportunity to measure your website's effectiveness. For example, if you run a bakery, a conversion might be someone placing an order online, but another could be someone using the contact form to book a wedding cake tasting.
Setting Up Goals in Google Analytics: Now, let's tell Google Analytics what we consider a conversion.
Log in to your Google Analytics account.
Navigate to the "Admin" section (the gear icon at the bottom left).
In the "View" column, click on Goals.Click the "+ New Goal" button.
You'll see several pre-built goal templates (e.g., "Revenue," "Acquisition," "Inquiry") and a "Custom" option. If one of the templates matches your goal, use it. Otherwise, select Custom.Give your goal a descriptive name (e.g., "Contact Form Submission," "Completed Purchase").
Choose a goal type: Destination:Triggered when a user reaches a specific page (e.g., a "Thank You" page after submitting a form). This is the most common type.
Duration: Triggered when a user spends a certain amount of time on your site.
Pages/Screens per session: Triggered when a user views a certain number of pages during a single session.
Event: Triggered when a specific event occurs (e.g., clicking a button, playing a video). This requires more technical setup.
Follow the on-screen instructions to configure your goal based on the selected type. For example, if you choose "Destination," you'll need to enter the URL of the "Thank You" page. If you choose "Event," you'll need to configure event tracking (more on that later).
Verify your goal by clicking the "Verify" button. This will show you the conversion rate for the past seven days based on the data Google Analytics has already collected.
Click "Save" to activate your goal.
Don't be afraid to experiment with different goal types and configurations. The key is to set up goals that accurately reflect your business objectives and provide meaningful insights into your website's performance.
Diving Deeper: Event Tracking
While Destination goals are great for tracking pageviews, sometimes you need to track actions thatdon'tnecessarily lead to a new page load. That's where event tracking comes in. Think of it as tracking interactive elements on your website.
What are Events? Events are user interactions that you want to track independently of pageviews. Examples include: Clicking a button (e.g., "Add to Cart," "Download Now").
Playing a video.
Submitting a form without a page reload.
Interacting with a specific element on the page.
Setting Up Event Tracking: Event tracking requires adding code to your website. This code tells Google Analytics to record a specific event whenever a user performs the corresponding action. You'll likely need a developer to help you with this. The basic structure of an event tracking code snippet looks like this:
```javascript
gtag('event', 'event_name', {
'event_category': 'category_name',
'event_label': 'label_name',
'value': value
});
```
event_name: This is the name of the event you're tracking (e.g., 'add_to_cart').
event_category:This is a broader category for the event (e.g., 'ecommerce').
event_label:This is a more specific label for the event (e.g., 'red_sweater').
value:This is an optional numerical value associated with the event (e.g., the price of the item added to the cart).
You'll need to adapt this code to your specific needs and implement it on your website. For example, if you want to track clicks on a "Download Now" button, you would add the code to the button's click handler.
Creating Goals from Events: Once you've implemented event tracking, you can create goals in Google Analytics based on those events. When creating a new goal, select "Event" as the goal type and enter the category, action, label, and value that you defined in your event tracking code.
Event tracking is a powerful tool for gaining a deeper understanding of user behavior on your website. It allows you to track interactions that would otherwise be invisible to Google Analytics.
Understanding Conversion Rate Metrics
Now that you're tracking conversions, it's time to analyze the data and see what'sactuallyhappening on your website. Google Analytics provides a variety of metrics to help you understand your conversion rates.
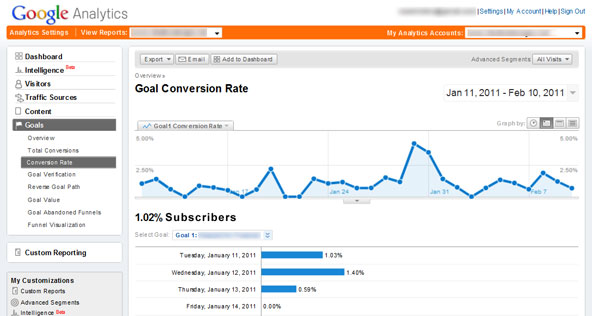
Conversion Rate: This is the most basic and important metric. It's the percentage of visitors who complete a conversion goal. It's calculated as (Total Conversions / Total Sessions) \100. For example, if you had 1000 sessions and 50 conversions, your conversion rate would be 5%.
To view your conversion rate in Google Analytics, navigate to "Conversions" -> "Goals" -> Overview.Goal Completion:This is the total number of times a specific goal was completed. It's a useful metric for tracking the overall success of your website.
You can view goal completions for each goal in the "Conversions" -> "Goals" -> "Overview" report.
Goal Value: This is the monetary value you assign to each goal completion. It's useful for calculating the return on investment (ROI) of your website.
You can assign a value to each goal when you set it up in Google Analytics.
The Goal Value metric is displayed in the "Conversions" -> "Goals" -> "Overview" report.
Conversion Funnels: These are visual representations of the steps users take to complete a conversion goal. They can help you identify bottlenecks in your conversion process.
To set up a conversion funnel, go to "Admin" -> "Goals" and enable the "Funnel" option for a specific goal.
You can then view the funnel in the "Conversions" -> "Goals" -> "Funnel Visualization" report.
Multi-Channel Funnels: These reports show you the different marketing channels that contribute to conversions. They can help you understand how different channels work together to drive results.
To access multi-channel funnel reports, go to "Conversions" -> "Multi-Channel Funnels."
By tracking these metrics, you can gain a comprehensive understanding of your website's conversion performance and identify areas for improvement.
Analyzing Your Conversion Data
Okay, you've got goals set up, you're tracking events, and you're staring at a screen full of data. Now what? It's time to put on your detective hat and start analyzing your conversion data.
Segment Your Data: Don't just look at overall conversion rates. Segment your data to see how different groups of users are performing.
Traffic Source: Are users from Google Ads converting better than users from social media?
Device Type: Are mobile users converting as well as desktop users?
Demographics: Are younger users converting differently than older users?
New vs. Returning Visitors: Are returning visitors more likely to convert?
By segmenting your data, you can identify specific areas where you need to focus your efforts. For example, if you find that mobile users are not converting well, you might need to optimize your website for mobile devices.
Identify Drop-Off Points: Use conversion funnels to identify where users are abandoning the conversion process.
Are users dropping off on the checkout page? If so, you might need to simplify your checkout process.
Are users dropping off on the product page? If so, you might need to improve your product descriptions or add more compelling images.
Are users dropping off on the landing page? If so, you might need to improve your landing page copy or design.
By identifying drop-off points, you can focus your efforts on fixing the specific problems that are preventing users from converting.
Test Different Variations: Use A/B testing to compare different versions of your website and see which one performs better.
Test different headlines, calls to action, images, and page layouts.
Use a tool like Google Optimize to run A/B tests.
Track your conversion rates for each variation and choose the one that performs best.
A/B testing is a powerful way to optimize your website for conversions. By testing different variations, you can find the ones that resonate best with your audience.
Look for Trends and Patterns: Don't just focus on individual data points. Look for trends and patterns over time.
Are your conversion rates increasing or decreasing?
Are there certain times of the year when your conversion rates are higher or lower?
Are there any correlations between your marketing campaigns and your conversion rates?
By looking for trends and patterns, you can gain a deeper understanding of your website's performance and make more informed decisions about your marketing strategy.
Taking Action Based on Your Findings
Analyzing your conversion data is only half the battle. The real challenge is taking action based on your findings.
Optimize Your Website: Based on your analysis, make changes to your website to improve your conversion rates.
Simplify your navigation.
Improve your landing page copy.
Add more compelling images and videos.
Make it easier for users to contact you.
Optimize your website for mobile devices.
By optimizing your website, you can make it easier for users to find what they're looking for and complete your conversion goals.
Refine Your Marketing Campaigns: Based on your analysis, refine your marketing campaigns to target the right audience and drive more qualified traffic to your website.
Target your ads to specific demographics and interests.
Use keywords that are relevant to your business.
Create compelling ad copy that encourages users to click.
Track your conversion rates for each campaign and optimize your campaigns accordingly.
By refining your marketing campaigns, you can ensure that you're spending your money wisely and driving the most qualified traffic to your website.
Continuously Monitor and Improve: Conversion optimization is an ongoing process. Continuously monitor your conversion rates and make changes to your website and marketing campaigns as needed.
Set up alerts in Google Analytics to notify you when your conversion rates change significantly.
Regularly review your conversion data and look for new opportunities to improve.
Stay up-to-date on the latest conversion optimization best practices.
By continuously monitoring and improving, you can ensure that your website is always performing at its best.
Step Four:
Alright, friends, we've covered alotof ground. We've gone from understanding what conversion rates are, to setting up goals in Google Analytics, to analyzing your data, and finally, to taking action based on your findings. Basically, you've taken a crash course inhow to use Google Analytics to track conversion rates. You're basically web analyst material now!
To recap, remember these key takeaways: Define your conversion goals: What do you want visitors todoon your website? Set up goals in Google Analytics: Tell Google Analytics what you consider a conversion. Track events: Track user interactions that don't necessarily lead to a page load. Analyze your data: Segment your data, identify drop-off points, and look for trends. Take action: Optimize your website and refine your marketing campaigns based on your findings. Continuously monitor and improve: Conversion optimization is an ongoing process.
Now, it's time to put your newfound knowledge to work! Don't just let this information sit in your brain like a forgotten New Year's resolution. Open up Google Analytics, dive into your data, and start optimizing your website for conversions. Your business (and your wallet) will thank you for it.
So, here's your call to action: Set up at least one new conversion goal in Google Analytics today. Seriously, just do it. Even if it's something simple like tracking visits to your "Contact Us" page, it's a start.
Remember, even small improvements in your conversion rates can have ahugeimpact on your bottom line. So don't be afraid to experiment, try new things, and see what works best for your audience.
You've got this! Now go out there and make your website a conversion-generating machine! What’s the one change you're going to make to your website based on what you've learned today?
Post a Comment for "How to Use Google Analytics to Track Conversion Rates"
Post a Comment