What's Driving the Stock Market?
The Figurative Bottom Line
In discussions about the stock market, the term "bottom line" is often used to refer to the essential point of a conversation. This metaphor originated from accounting, where the bottom line represents the final figure after all costs and expenses have been subtracted from revenue. Today, this concept helps investors understand why stock prices are at record highs.
Investors face several concerns, including slowing economic growth, hotter inflation, trade policy uncertainty, tight monetary policy, and heightened geopolitical tensions. These factors can create headwinds for sales and costs. However, what many overlook is the ability of companies to adapt and evolve in their relentless pursuit of earnings growth. The true bottom line is whether companies will continue to meet their earnings targets despite these challenges.
The Literal Bottom Line
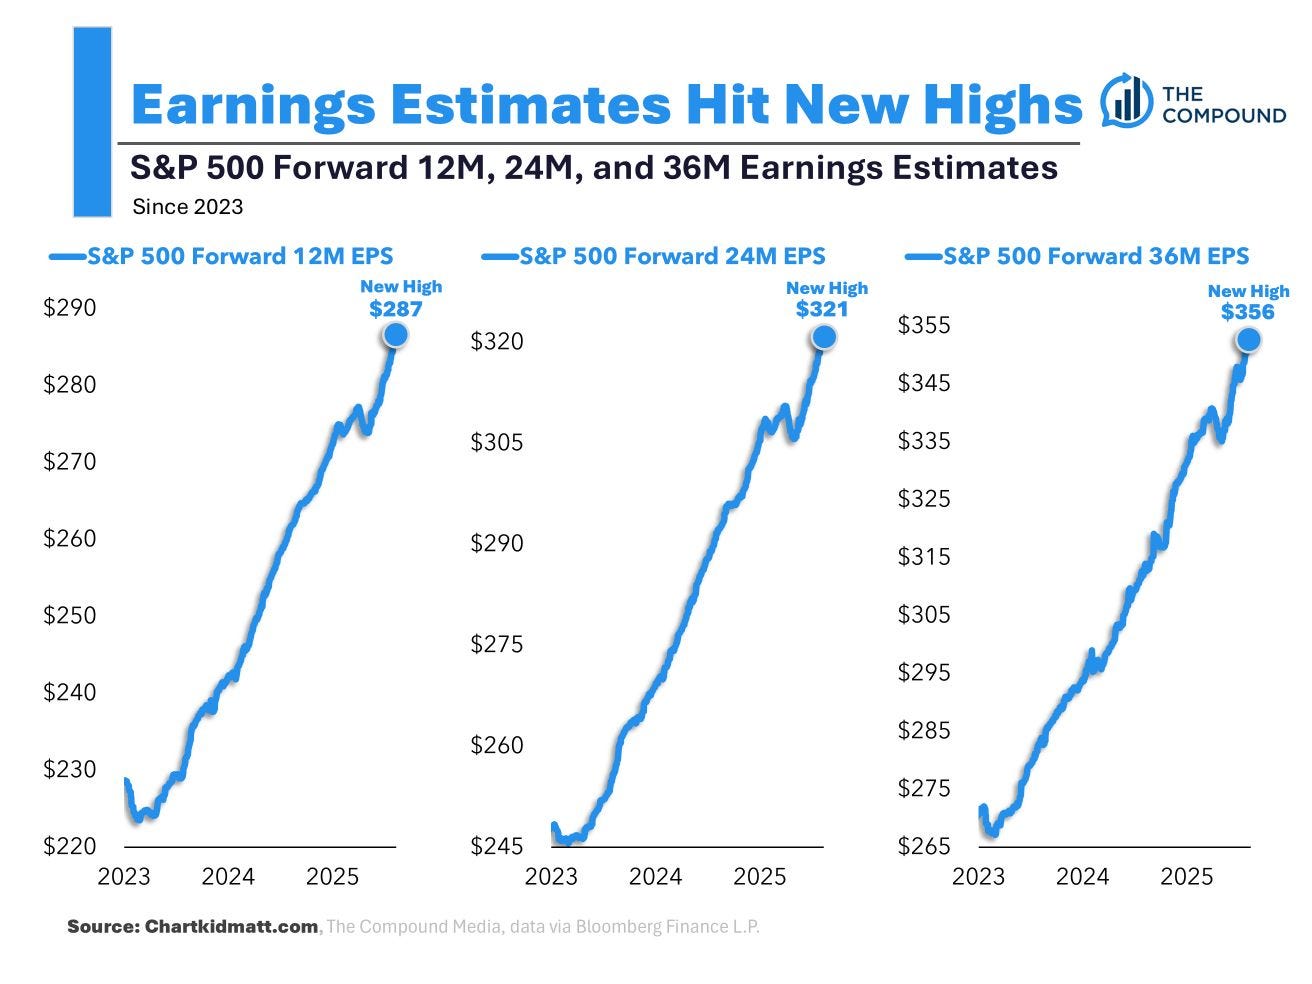
Earnings are the original bottom line. Q2 earnings season has largely concluded, and the message from Corporate America is clear: despite high uncertainty, the outlook for earnings growth is promising. Wall Street analysts agree, with their 12-month, 24-month, and 36-month outlooks confirming this optimism. For investors, it's important to recognize that both the figurative and literal bottom lines support the idea that earnings drive stock prices.
This bullish outlook for earnings is the simplest explanation for why the stock market is holding up. However, there are still risks to consider, such as the impact of new tariffs on profit margins. While the full effects of these tariffs are not yet clear, they could prove costly. The July Producer Price Index report suggests that tariffs are contributing to higher inflation, which could affect future demand.
Tariffs and Their Impact
Analysts expect that U.S. businesses are currently absorbing the incremental costs from higher tariffs, which is a headwind for profit margins. Eventually, consumers may bear most of these costs through higher prices, which could pressure future demand. Despite these concerns, high profit margins have persisted through 2021, 2022, 2023, and 2024, and they are expected to improve in 2025. This resilience suggests that Corporate America may surprise skeptics once again.
Macro Crosscurrents
Several notable data points and macroeconomic developments have emerged since the last review:
- Consumer price inflation ticks higher: The Consumer Price Index (CPI) in July was up 2.7% from a year ago, with core CPI rising to 3.1%. On a month-over-month basis, CPI increased by 0.2%, and core CPI by 0.3%.
- Wholesaler price inflation jumps: The Producer Price Index (PPI) in July rose 3.3% from a year ago, with core PPI increasing to 3.7%.
- Gas prices barely budge: The national average gas price returned to $3.16, with no indication of drastic moves in the near future.
- New unemployment claims tick lower: Initial claims for unemployment benefits declined to 224,000, while insured unemployment remained elevated.
- Shopping ticks higher: Retail sales increased 0.5% in July to a record $726.3 billion.
- Card spending data is holding up: Chase Consumer Card spending was 5.2% above the same day last year, and total card spending per household was up 3.5% y/y.
- Consumer sentiment deteriorates: Consumer sentiment fell back about 5% in August, with concerns about inflation driving the decline.
- Mortgage rates tick lower: The average 30-year fixed-rate mortgage declined to 6.58%, with purchase application activity improving.
- Industrial activity cools: Industrial production decreased 0.1% in July, with manufacturing output unchanged.
- Small business optimism ticks higher: The NFIB’s July Small Business Optimism Index rose to 100.3 from 98.6 in June.
- Offices remain relatively empty: Peak day office occupancy was 63.1%, down from the previous week.
- Near-term GDP growth estimates are tracking positively: The Atlanta Fed’s GDPNow model sees real GDP growth rising at a 2.5% rate in Q3.
Putting It All Together
The Trump administration’s pursuit of tariffs threatens to disrupt global trade, with significant implications for the U.S. economy, corporate earnings, and the stock market. Until more clarity is available, the current landscape shows that earnings look bullish, supported by expectations for years of earnings growth. Demand for goods and services remains positive, bolstered by healthy consumer and business balance sheets. Job creation, although cooling, remains positive, and the Federal Reserve has shifted its focus toward supporting the labor market.
However, growth is cooling as the economy normalizes from much hotter levels earlier in the cycle. While the economy remains healthy, it has become harder to argue that growth is destiny. The hard economic data continues to hold up, even as soft sentiment-oriented data remains poor. Stocks are not the economy, but they could outperform it in the near term due to positive operating leverage. Companies have adjusted their cost structures, resulting in robust earnings growth despite modest sales growth.
Investing is never a smooth ride, and economic recessions and bear markets are developments that all long-term investors should expect. There will always be risks to worry about, such as U.S. political uncertainty, geopolitical turmoil, energy price volatility, and cyber attacks. However, the long game remains undefeated, and it’s a streak that long-term investors can expect to continue. Always keep your stock market seat belts fastened.
Post a Comment for "What's Driving the Stock Market?"
Post a Comment