This free tool transformed my smart home troubleshooting
The Power of MQTT Explorer in a Smart Home Ecosystem
As a DIY enthusiast, I’ve come to understand that maintaining a smart home requires both time and attention to detail. I use a variety of affordable smart devices that operate over the Zigbee protocol with Home Assistant. Most of my IoT and smart devices rely on the MQTT protocol—short for Message Queuing Telemetry Transport—to communicate across the network. I chose MQTT because it is lightweight, ideal for low-power devices, and efficient for enabling real-time communication between smart devices.
Most off-the-shelf smart devices don’t support MQTT natively unless they are flashed with custom firmware or used with a compatible bridge. For example, I use a couple of Philips Hue smart bulbs linked to a Zigbee2MQTT bridge, which connects to an MQTT broker in Home Assistant. When these bulbs stop working, I use a free, open-source app called MQTT Explorer to troubleshoot them. As the name suggests, this tool works only with smart home devices that operate over the MQTT protocol. It has become an essential diagnostic tool for my smart home setup.
Why MQTT Explorer Stands Out
Best for Low-Power, DIY-Style Devices
While using Home Assistant, I initially relied on the Logbook and System Logs to troubleshoot devices, but that didn't provide much insight. The Home Assistant community recommended MQTT Explorer, which helped me diagnose and manage my smart and IoT devices that use MQTT. This tool allows me to investigate why certain smart bulbs become inactive after events like power outages. With MQTT Explorer, it's easier to check a device’s state or test its features. Using this app, I discovered that my Home Assistant automations were breaking because my family kept turning smart devices off after a power outage.
Even during the setup of smart bulbs, sending MQTT messages (payloads) to test or control their color, state, and brightness helped further customize and perfect the automation. The diagnostic tool is a lifesaver in revealing configuration issues and automation failures. I've used it with several devices that the Zigbee2MQTT frontend can't connect to.
Finding and Fixing Troublesome Smart Home Devices
Sifting Through Topics and Messages
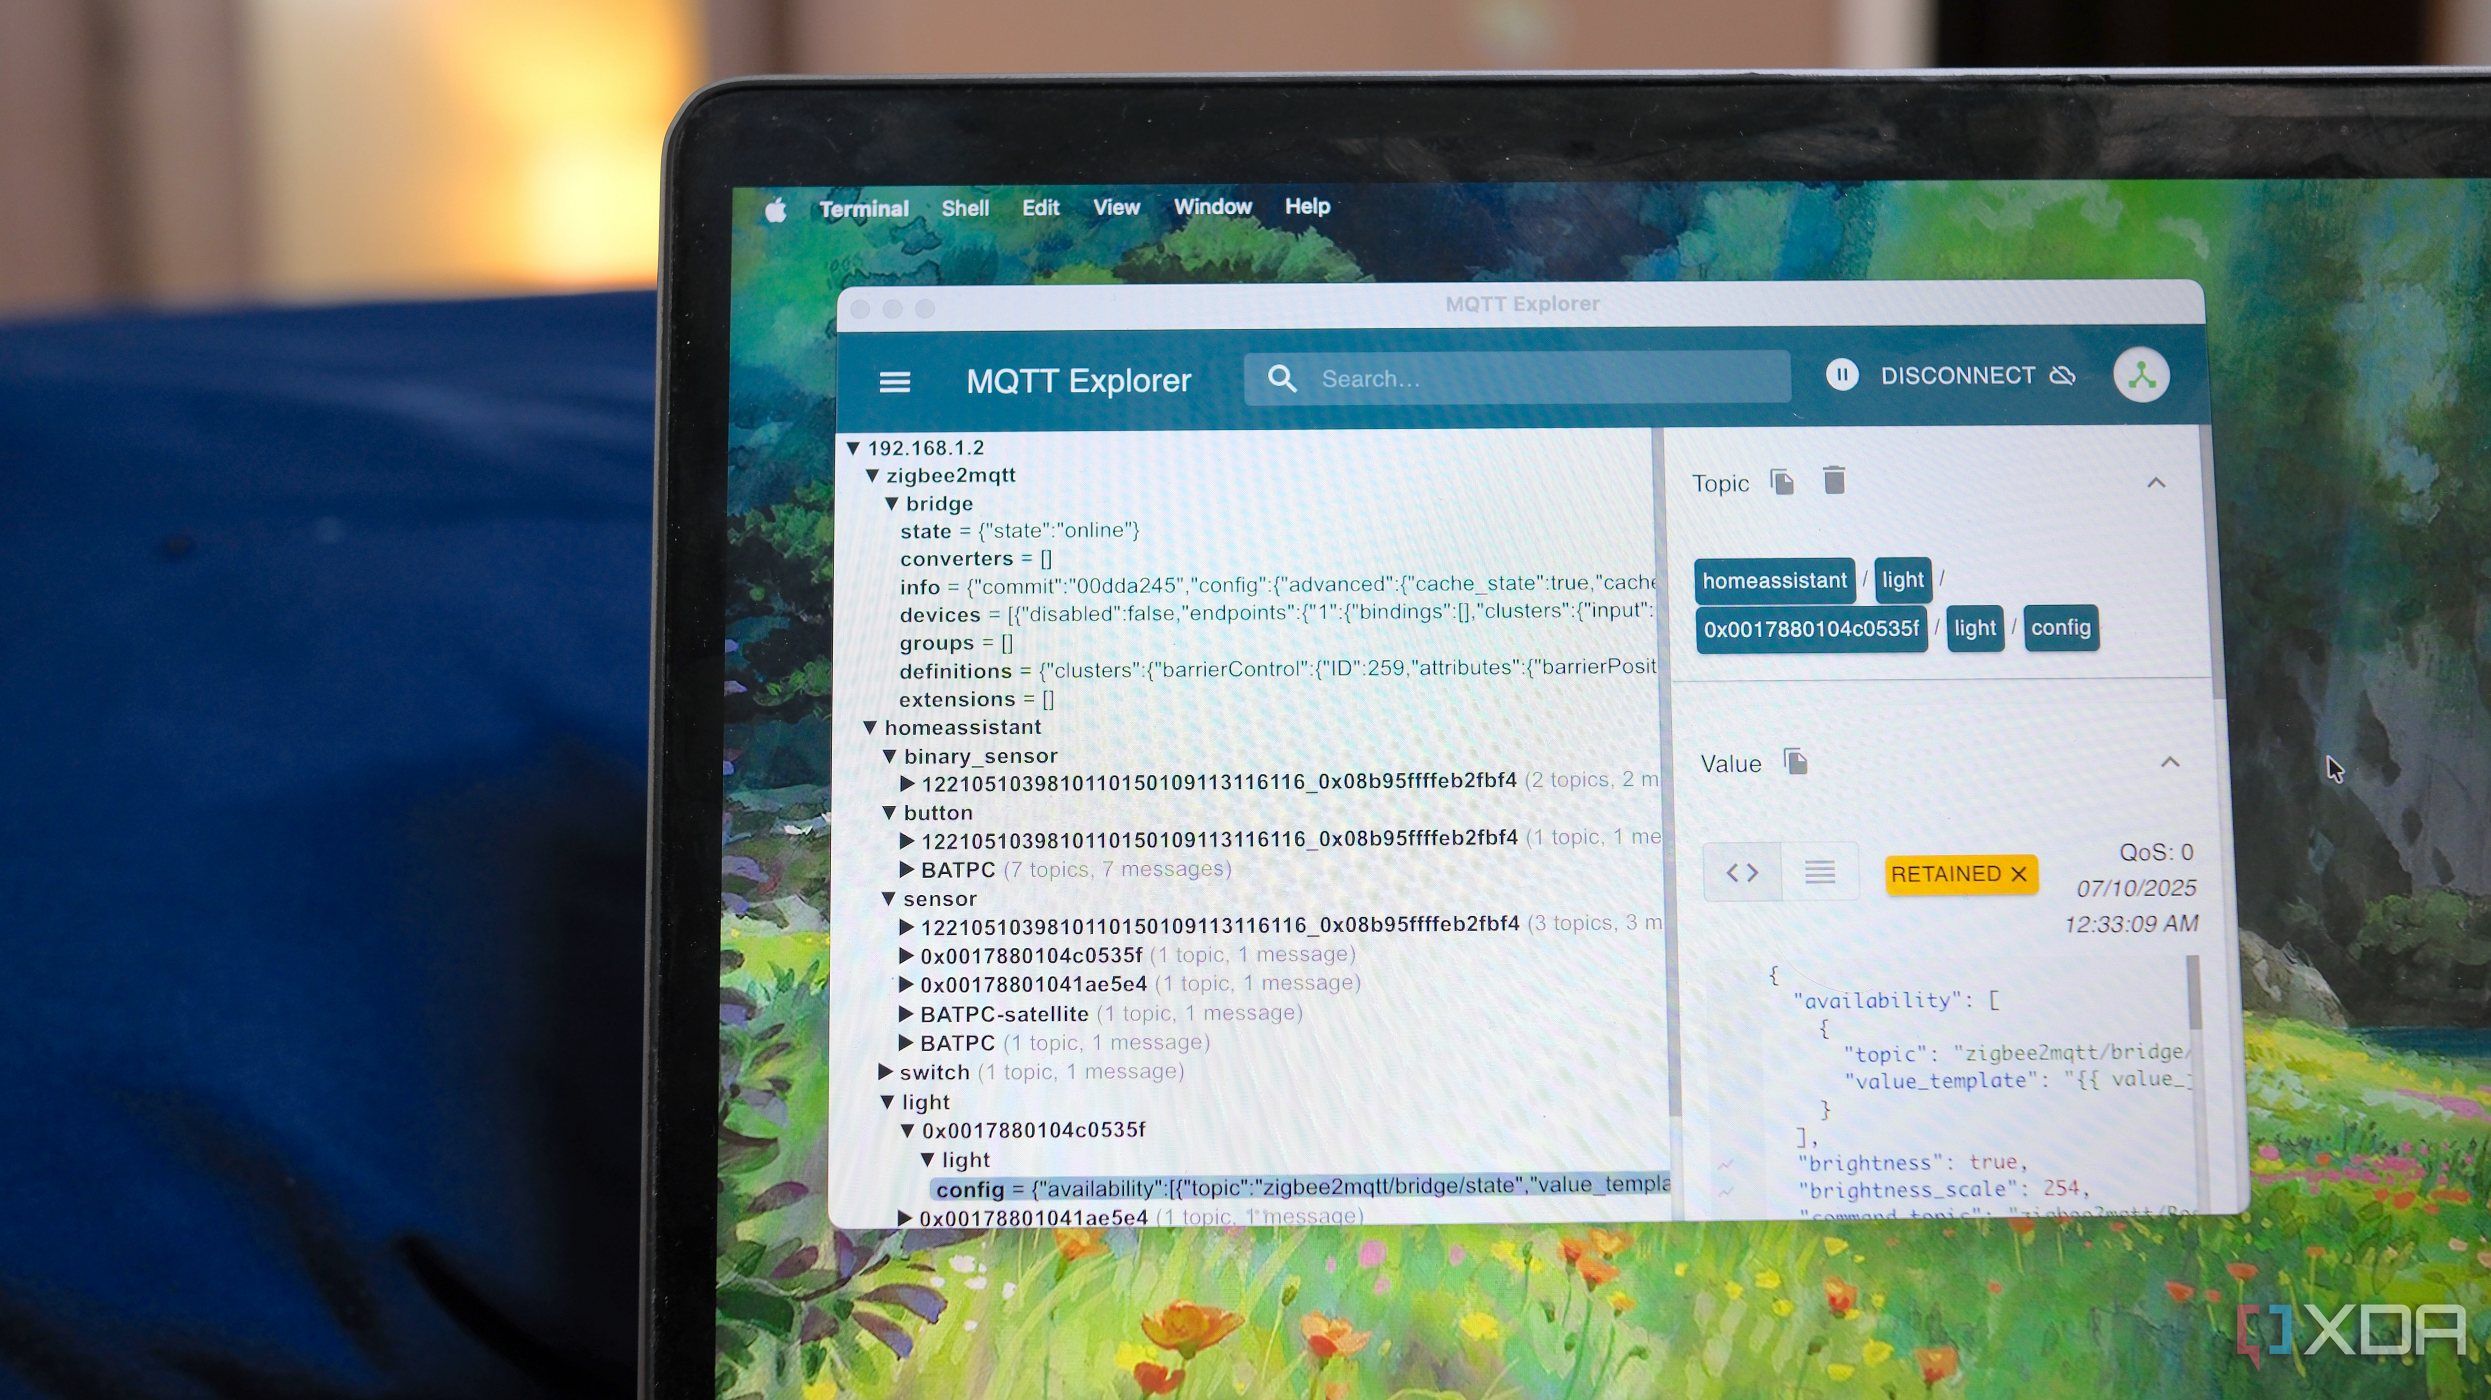
Unlike Home Assistant's manageable UI and YAML configurations, MQTT Explorer requires some learning. Once I entered the login credentials for my MQTT server, it instantly presented a nested tree of everything happening through the MQTT broker server. For instance, I see topics related to Zigbee2MQTT and Home Assistant, as well as top-level string labels for different components. The former lists it as a bridge for smart devices, while the latter displays the different topic trees for sensors, switches, lights, buttons, and other devices. That helps me narrow down the search and look for non-responsive devices. I look forward to the search bar at the top when I have hundreds of IoT devices and sensors in my home.
Under the Lights topic, my Philips Hue smart bulbs appear with a 64-bit MAC address along with messages, configuration, their state, and logs. Clicking on any bulb's config reveals the associated data in JSON format in a separate column. I can further review its message history and even publish (push) a custom message to other devices through it. Of course, that requires me to format the message values in JSON or XML format to make it easier for MQTT brokers to process.
Teaming Up with Node-RED and Home Assistant for Troubleshooting
Combining Multiple Tools for Diagnosing Issues
Sometimes, it's not just one smart device acting up. I often dive into Home Assistant's Logs when I can't get enough information from MQTT Explorer about a failed integration. That's how I learned that the PulseAudio service kept crashing and consuming system resources. While MQTT Explorer helps with monitoring and managing smart devices, handling automations with Node-RED integration becomes easier in Home Assistant. Besides, it provides an improved interface for handling errors and debugging automation flows, especially those that link outside Home Assistant. I struggle with its steep learning curve, but Node-RED can help you troubleshoot the exact point where the automation breaks and streamline complicated ones.
For Z-Wave smart devices, the Z-Wave JS UI add-on for Home Assistant is a great addition. Meanwhile, the ESPHome Device Builder add-on serves as a dashboard for configuring and monitoring multiple ESPHome devices and sensors. TasmoAdmin add-on helps to troubleshoot smart devices flashed with Tasmota firmware. Using it alongside MQTT Explorer enables the configuration and checking of smart device status.
The Ultimate Tool for DIY Smart Home Enthusiasts
MQTT Explorer has quickly become a must-have diagnostic tool for DIY enthusiasts like me, as I continue to discover new ways to make the best of Home Assistant. Several times, it revealed why select sensors and smart devices had become unresponsive. This feature-rich tool is capable of setting up alerts about the state of smart home devices and works on Windows, macOS, and Linux. It has become my go-to tool for examining and removing outdated messages from smart devices I no longer use with Home Assistant. With MQTT Explorer in your diagnostic arsenal, you can confidently add smart devices and sensors to improve your smart home.
Post a Comment for "This free tool transformed my smart home troubleshooting"
Post a Comment